How drone mapping makes on-farm test plots relevant
Stratus Imaging with the help of Precision Agronomics in Australia, used Pix4D to provide plot level statistics for a large research/government group on a non-commercial farm. The goal was to acquire precise and measurable maps that helped the group to understand crop changes over time and different input applications.
Pix4D is always working towards providing the most accurate maps possible, so you can take the information from those maps to the next level and run your farms more efficiently.
Why plot level statistics?
The importance of plot level statistics make agriculture efficient, profitable, and sustainable ensuring that new techniques are proven to work. Scientific evidence is the key for new agricultural techniques to move their way into the mass market. Projects like this one reinforce that goal, replicable numbers become the building block for everything else.Generating plot level statistics with industry experts
Stratus Imaging saw the potential of this new tool to improve current workflows on test plot analysis. They approached several large research companies and government organizations with the intent to provide high resolution maps and statistical data for field research trials over multiple drone flights.
The goal was to prove how much more understanding of those changes can be derived from radiometrically correct Index maps and all derived statistical data. From early on, the interest for the project was exceptional, and quickly Stratus Imaging found a group interested in working with them.
Acquiring data with a RedEdge camera
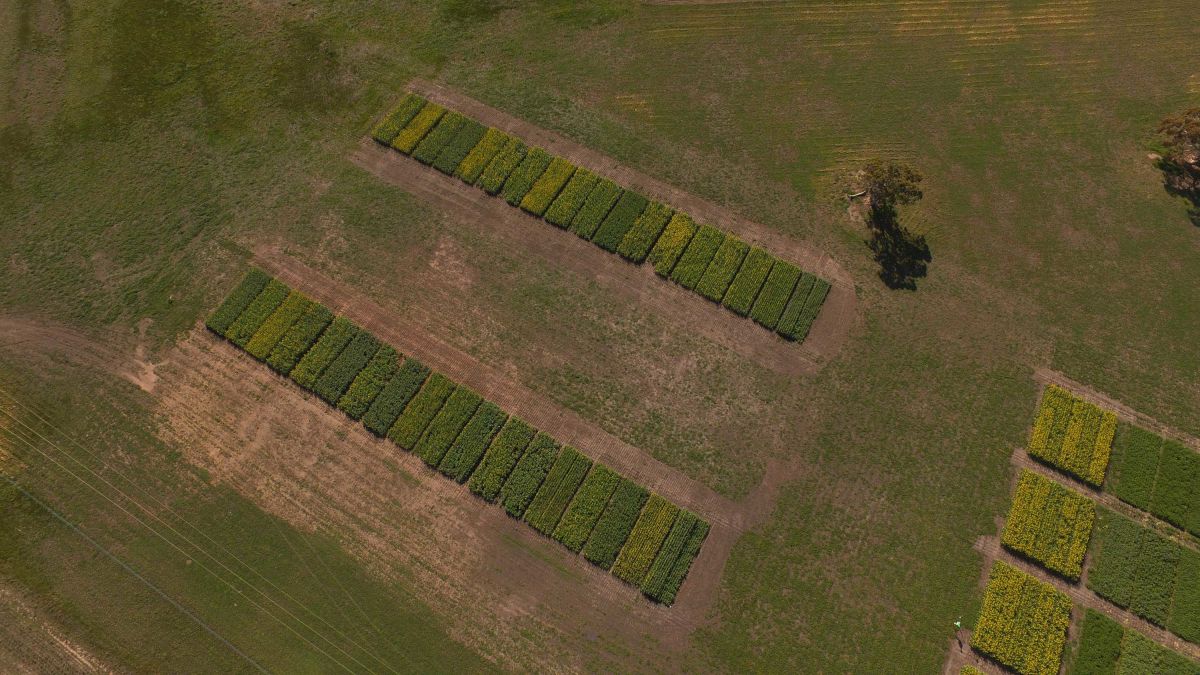
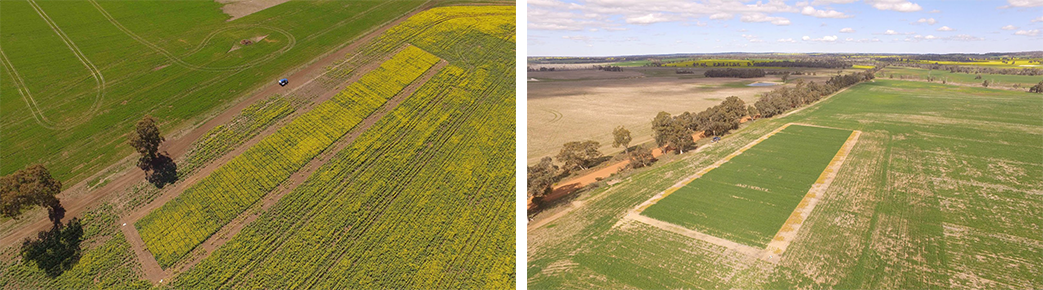
Even though the trials were relatively small (30m x 100m), and each trial site was made of small plots (1.8m x 15m), every flight had to be carefully planned.
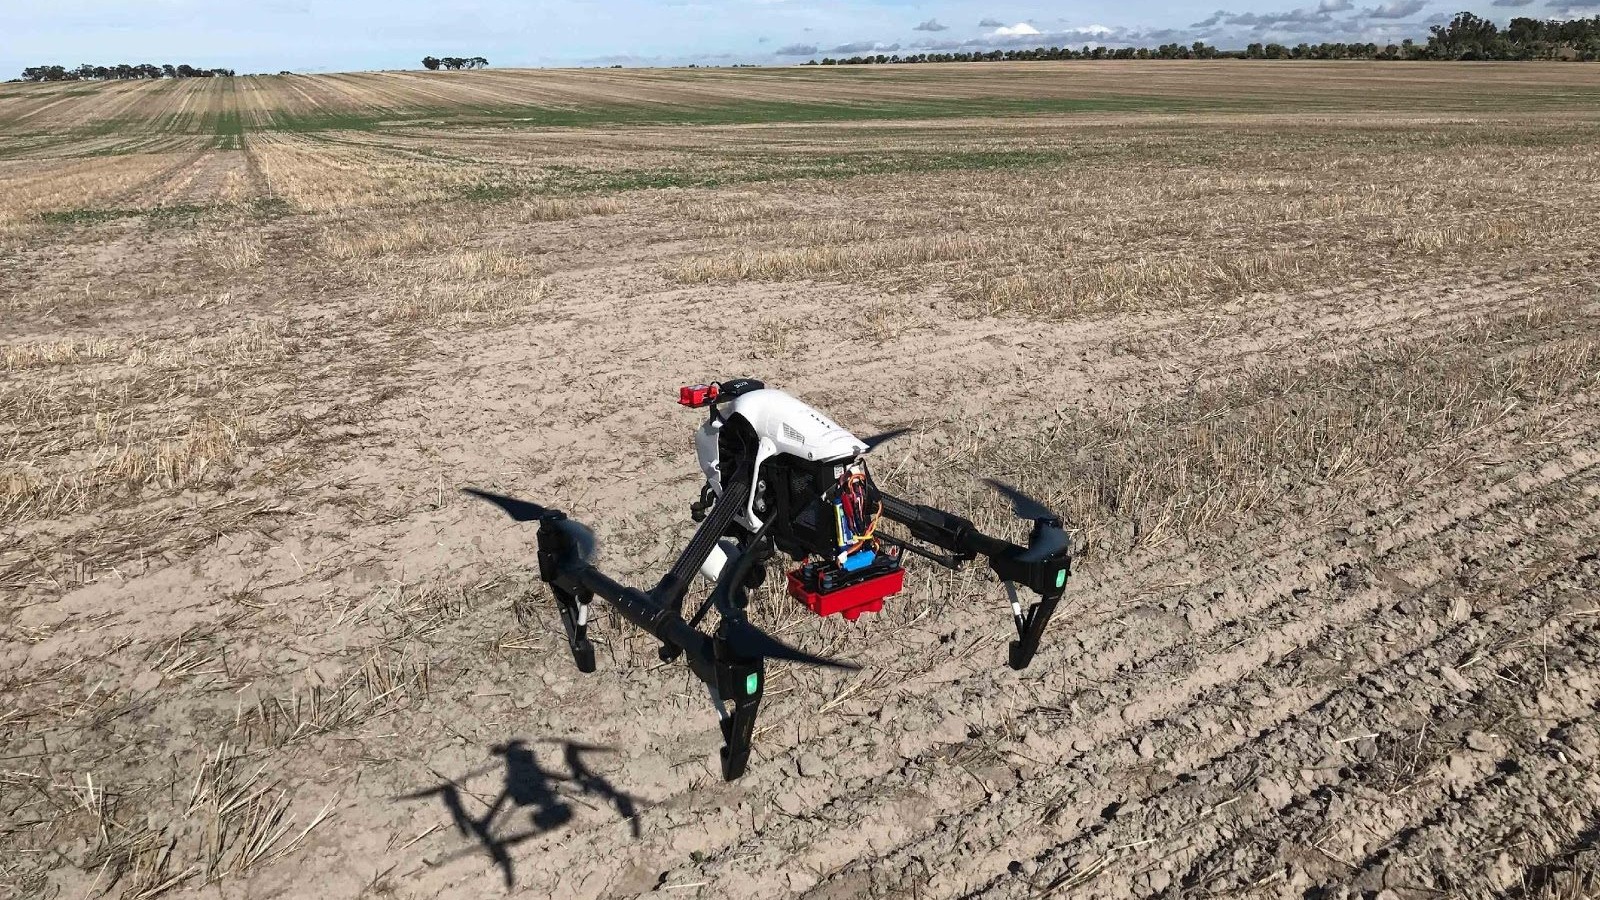
The target was to provide sub centimeter resolution: the drone was flown at 60ft (18m) with 80% overlap to ensure accurate data acquisition with a RedEdge 3 multispectral camera mounted on a DJI Inspire 1 drone. Once emergence had occurred, six flights were conducted approximately every two weeks.
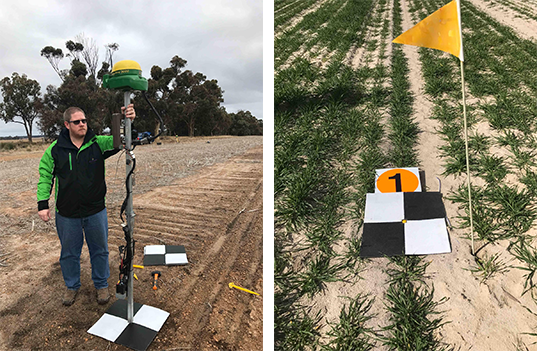
GCPs on the field
Ground control points (GCPs) were placed just after seeding on each corner, allowing for accurate data processing of subsequent flights.
If the goal is to proceed with temporal analysis, it is always necessary to make sure all maps are properly georeferenced.
Radiometric accuracy with Pix4D
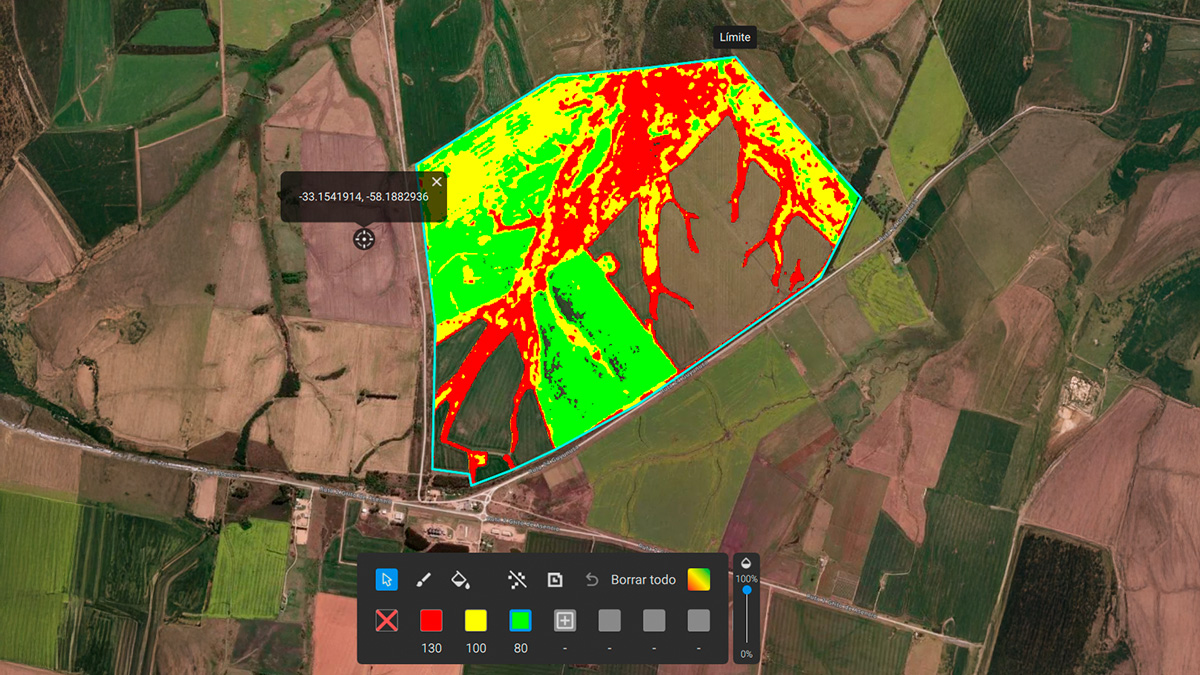
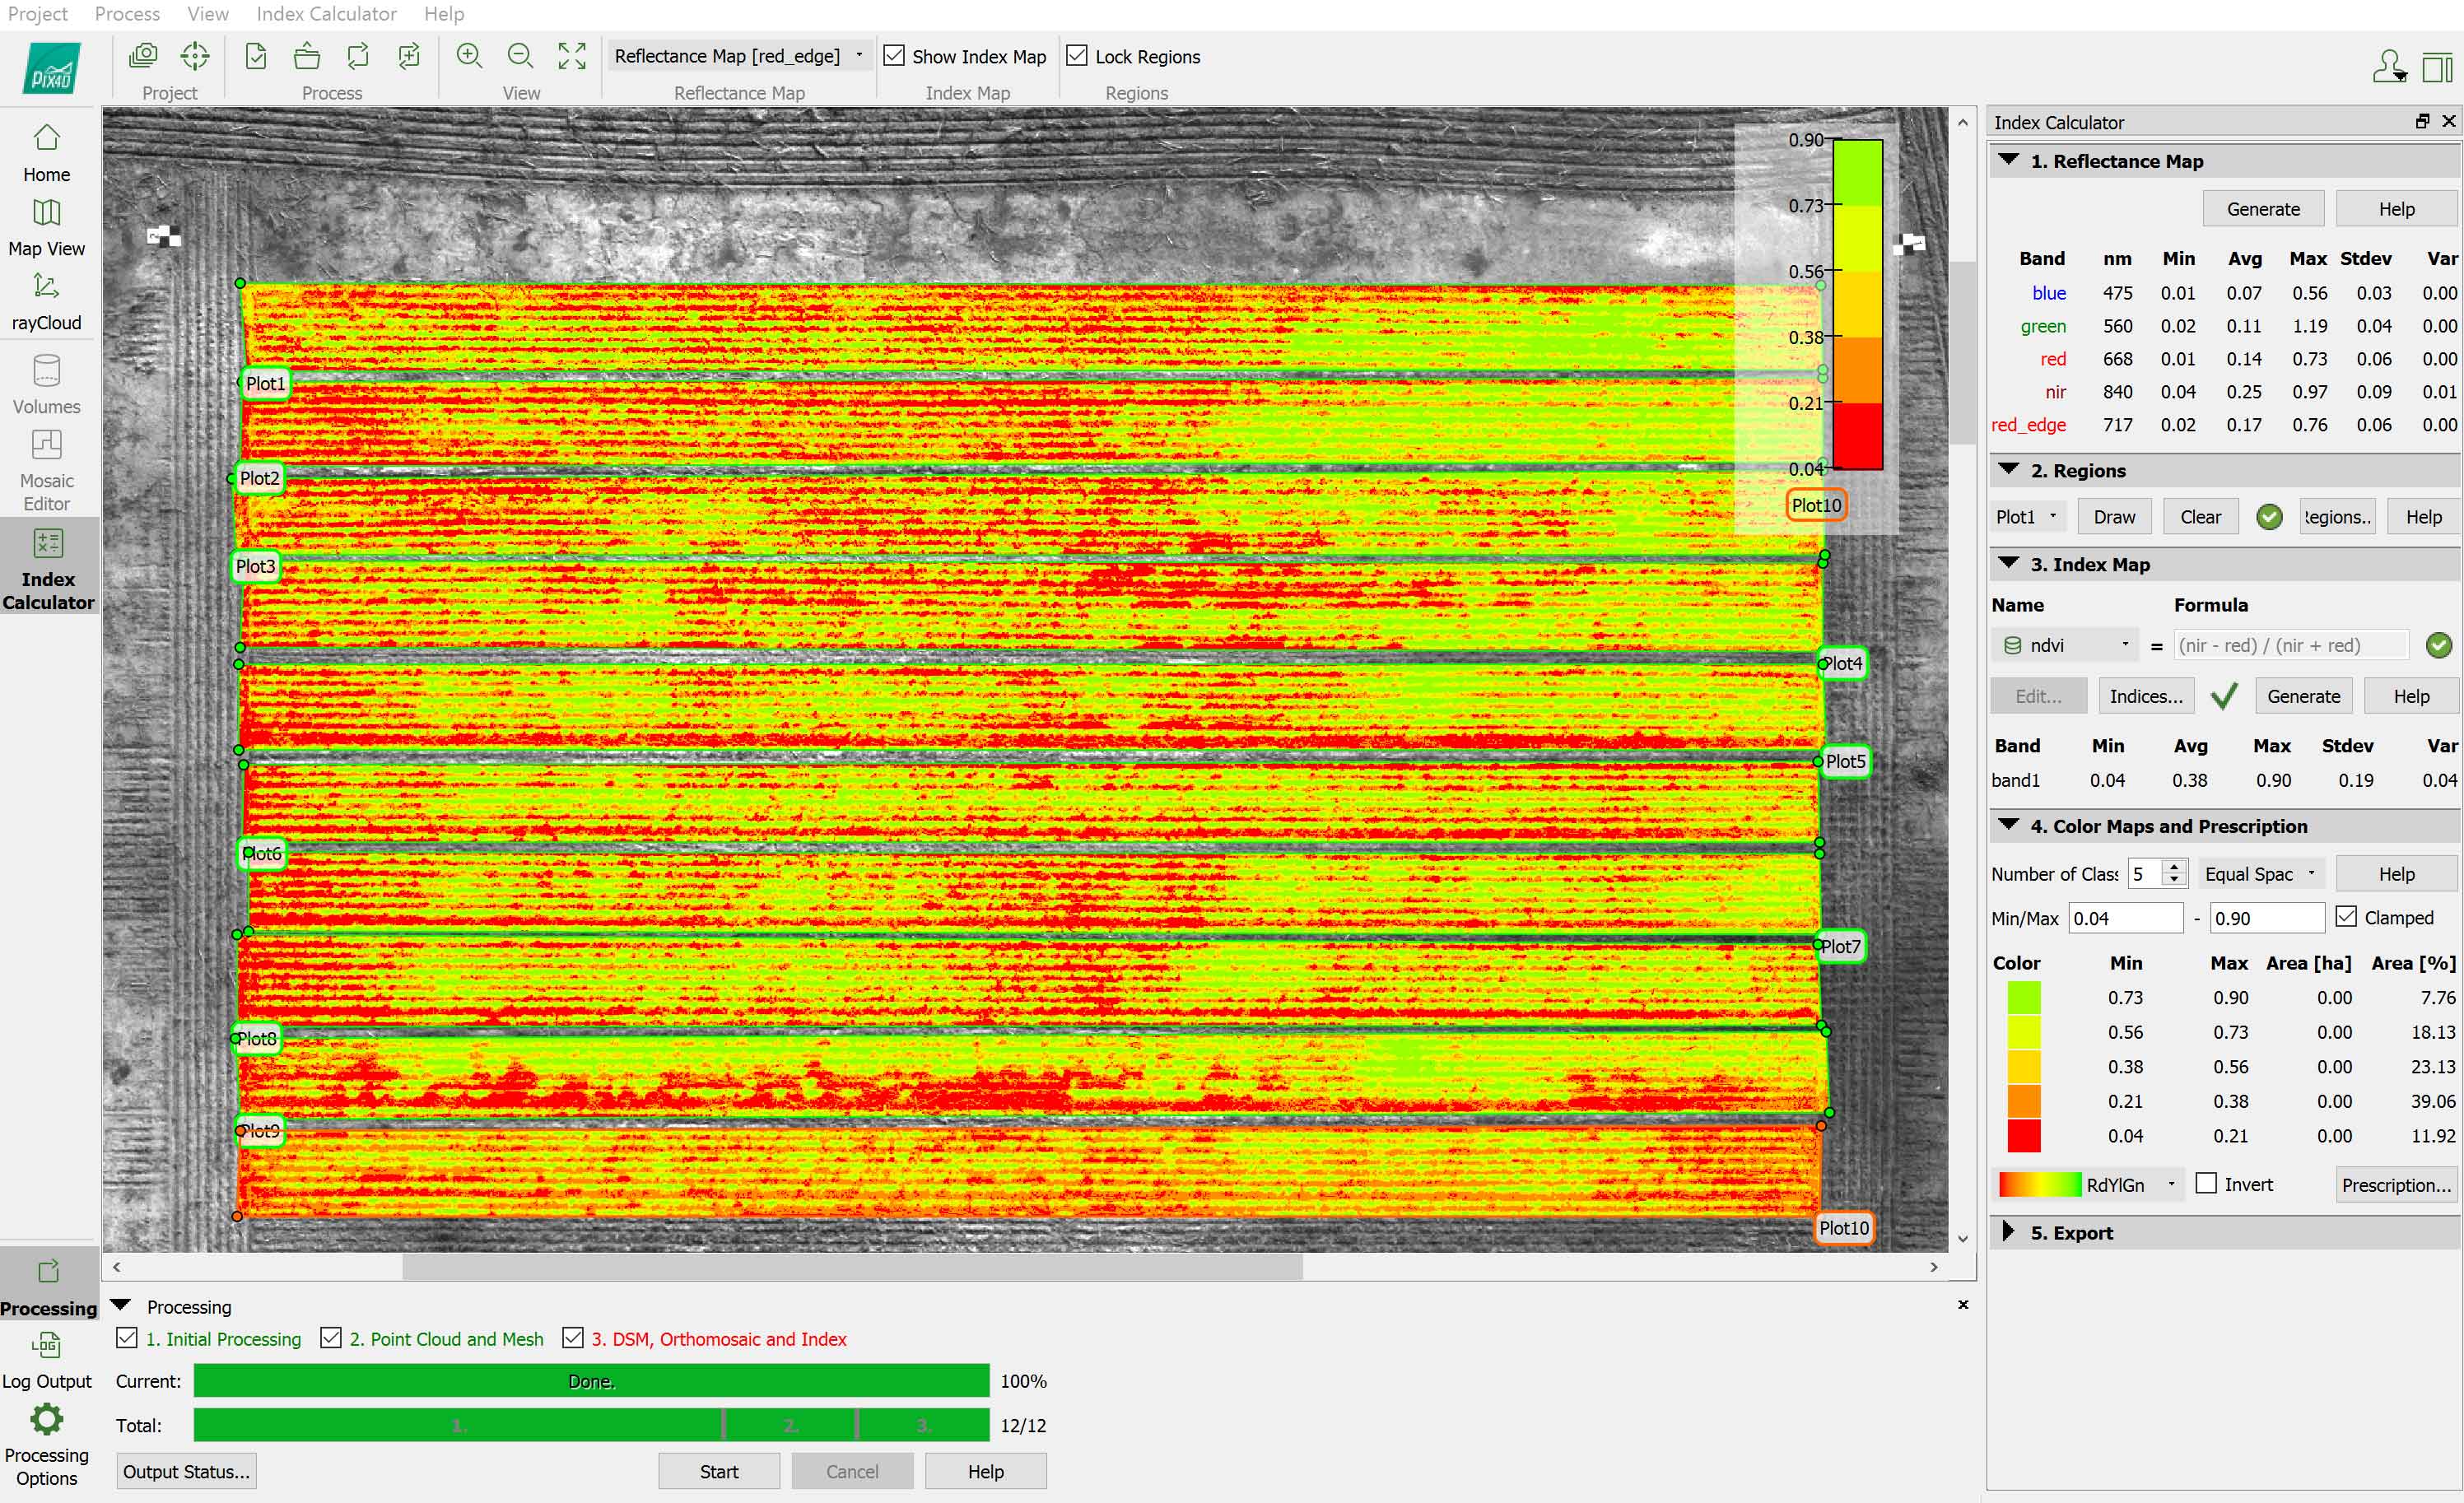
The data was processed using Pix4Dfields software, allowing for an easy, offline and radiometrically correct generation of reflectance maps from multispectral images, including the data from the GCPs. When it comes to comparing data over time, it’s absolutely critical to make sure that those maps account for different illumination conditions. If you want to derive decision from those trends, maps need to be comparable.
The radiometric accuracy of the maps across several flights is critical when it comes to comparing data.
Delivering the right statistics was challenging, and Stratus Imaging partnered up with a company with experience in high resolution data and statistical information. They reached out to Precision Agronomics Australia, and together with Frank D’Emden (Technology Development Manager), they mapped out a successful process flow.
Once the reflectance maps were generated, Stratus imaging could easily export the GeoTIFF files and provide those to Frank D’Emden’s team so that they can start deriving statistics from the data at the plot level.
Andrew Dedman, Director and Operations Manager of Stratus Imaging noted: “Plot level statistics gave researchers quantitative information for each plot, in comparison to the more subjective measurements carried out in the past”
Reliable results open the door to future projects
The truth is in objective and replicable numbers
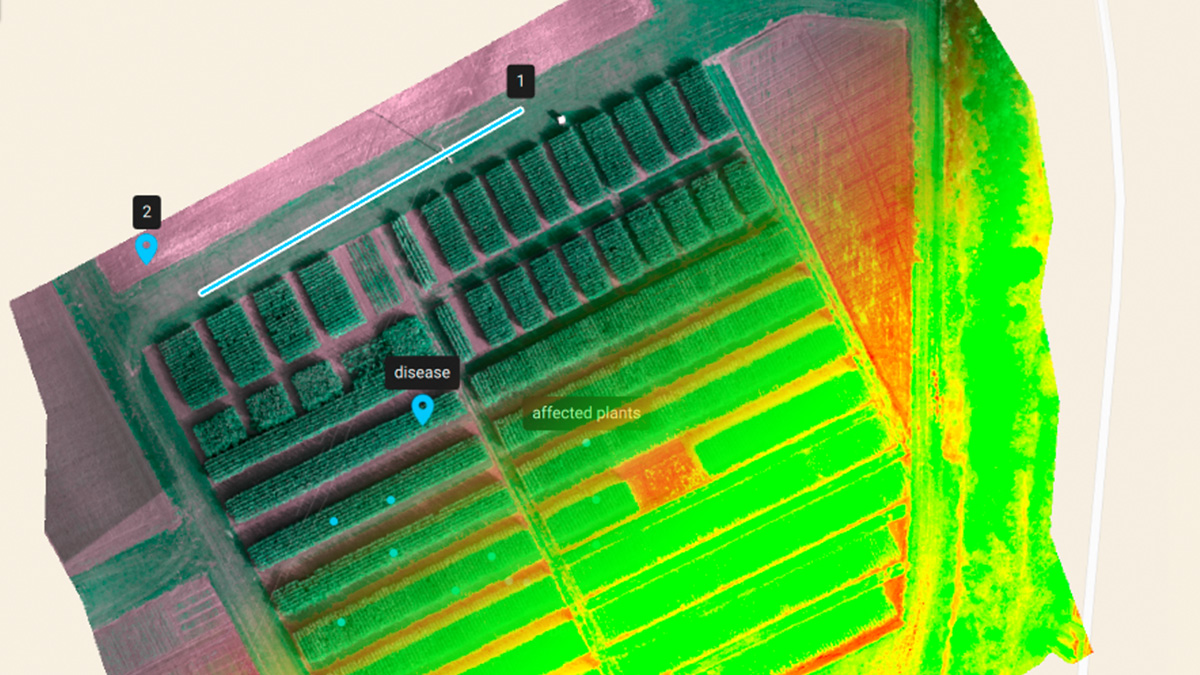
Flying over the plots and deriving plot statistical information (NDVI mean, median, stdev and min & max) from indices helped the researchers in this project to understand the impact of different agricultural techniques over the crops. Reports like the below were generated after every flight.
Farmers, agronomists, breeders and R&D teams covering the whole agriculture spectrum, are constantly evolving and improving. To get better yields with less input is a work of art, and drone mapping is allowing these groups to understand their decisions, and ramifications in an objective and quantitative way.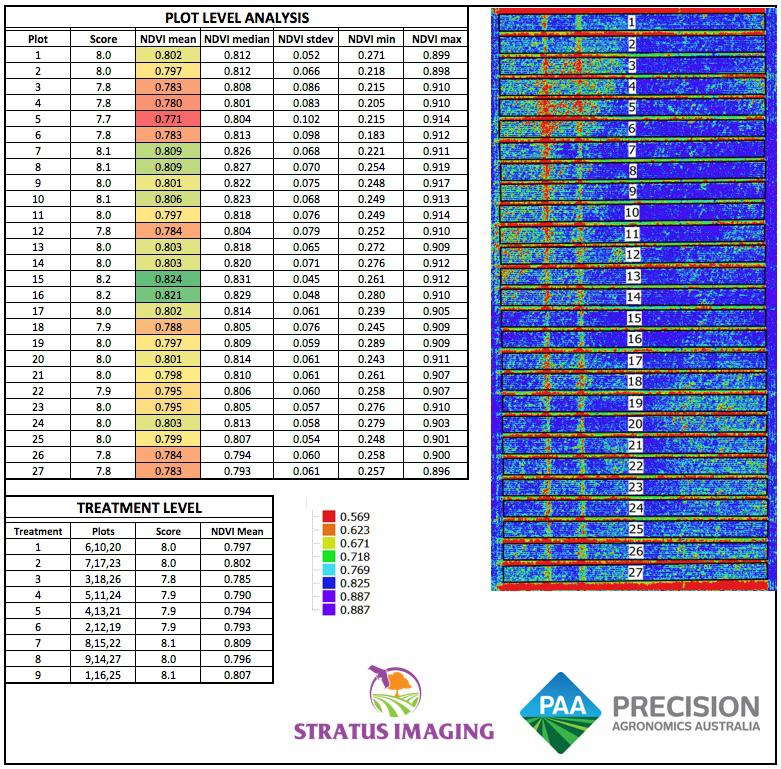
Stratus Imaging is leading some of these efforts in Australia, and thanks to this initiative they were granted many more projects with this group and other groups, looking into the same kind of analysis.
Special thanks
| Special thanks to Andrew Dedman for sharing this beautiful story with us | |
| If you would like to know more about the project, contact Stratus Imaging team at andrew@stratusimaging.com.au |