Storm bite on sandy beaches: erosion volume measurement
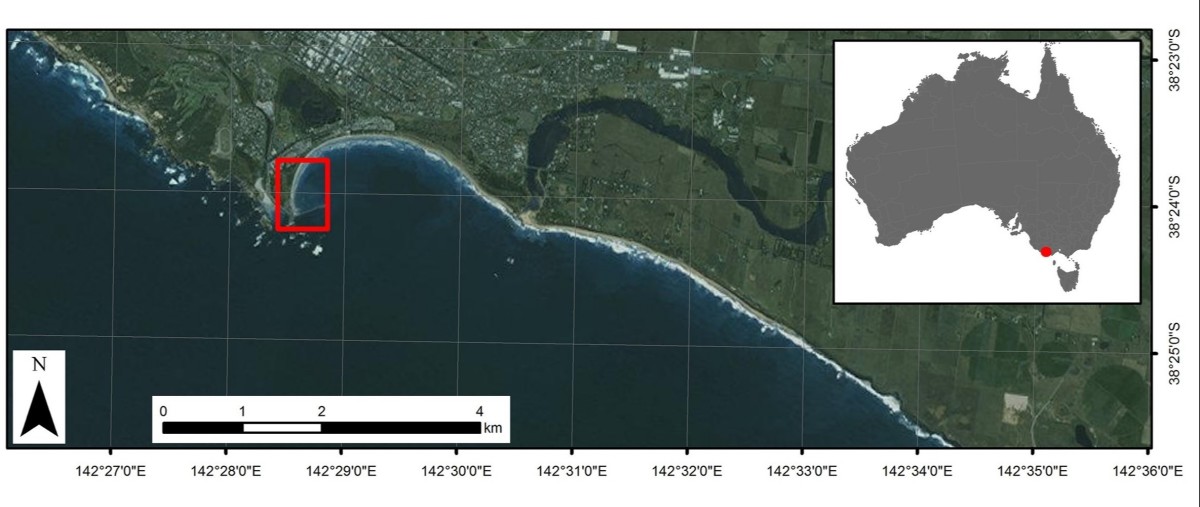
Both before and after a major storm event, the School of Life and Environmental Sciences and Center of Integrative Ecology from Deakin University used a drone to survey a stretch of sandy beach on the open-coast shoreline of Victoria, Australia.
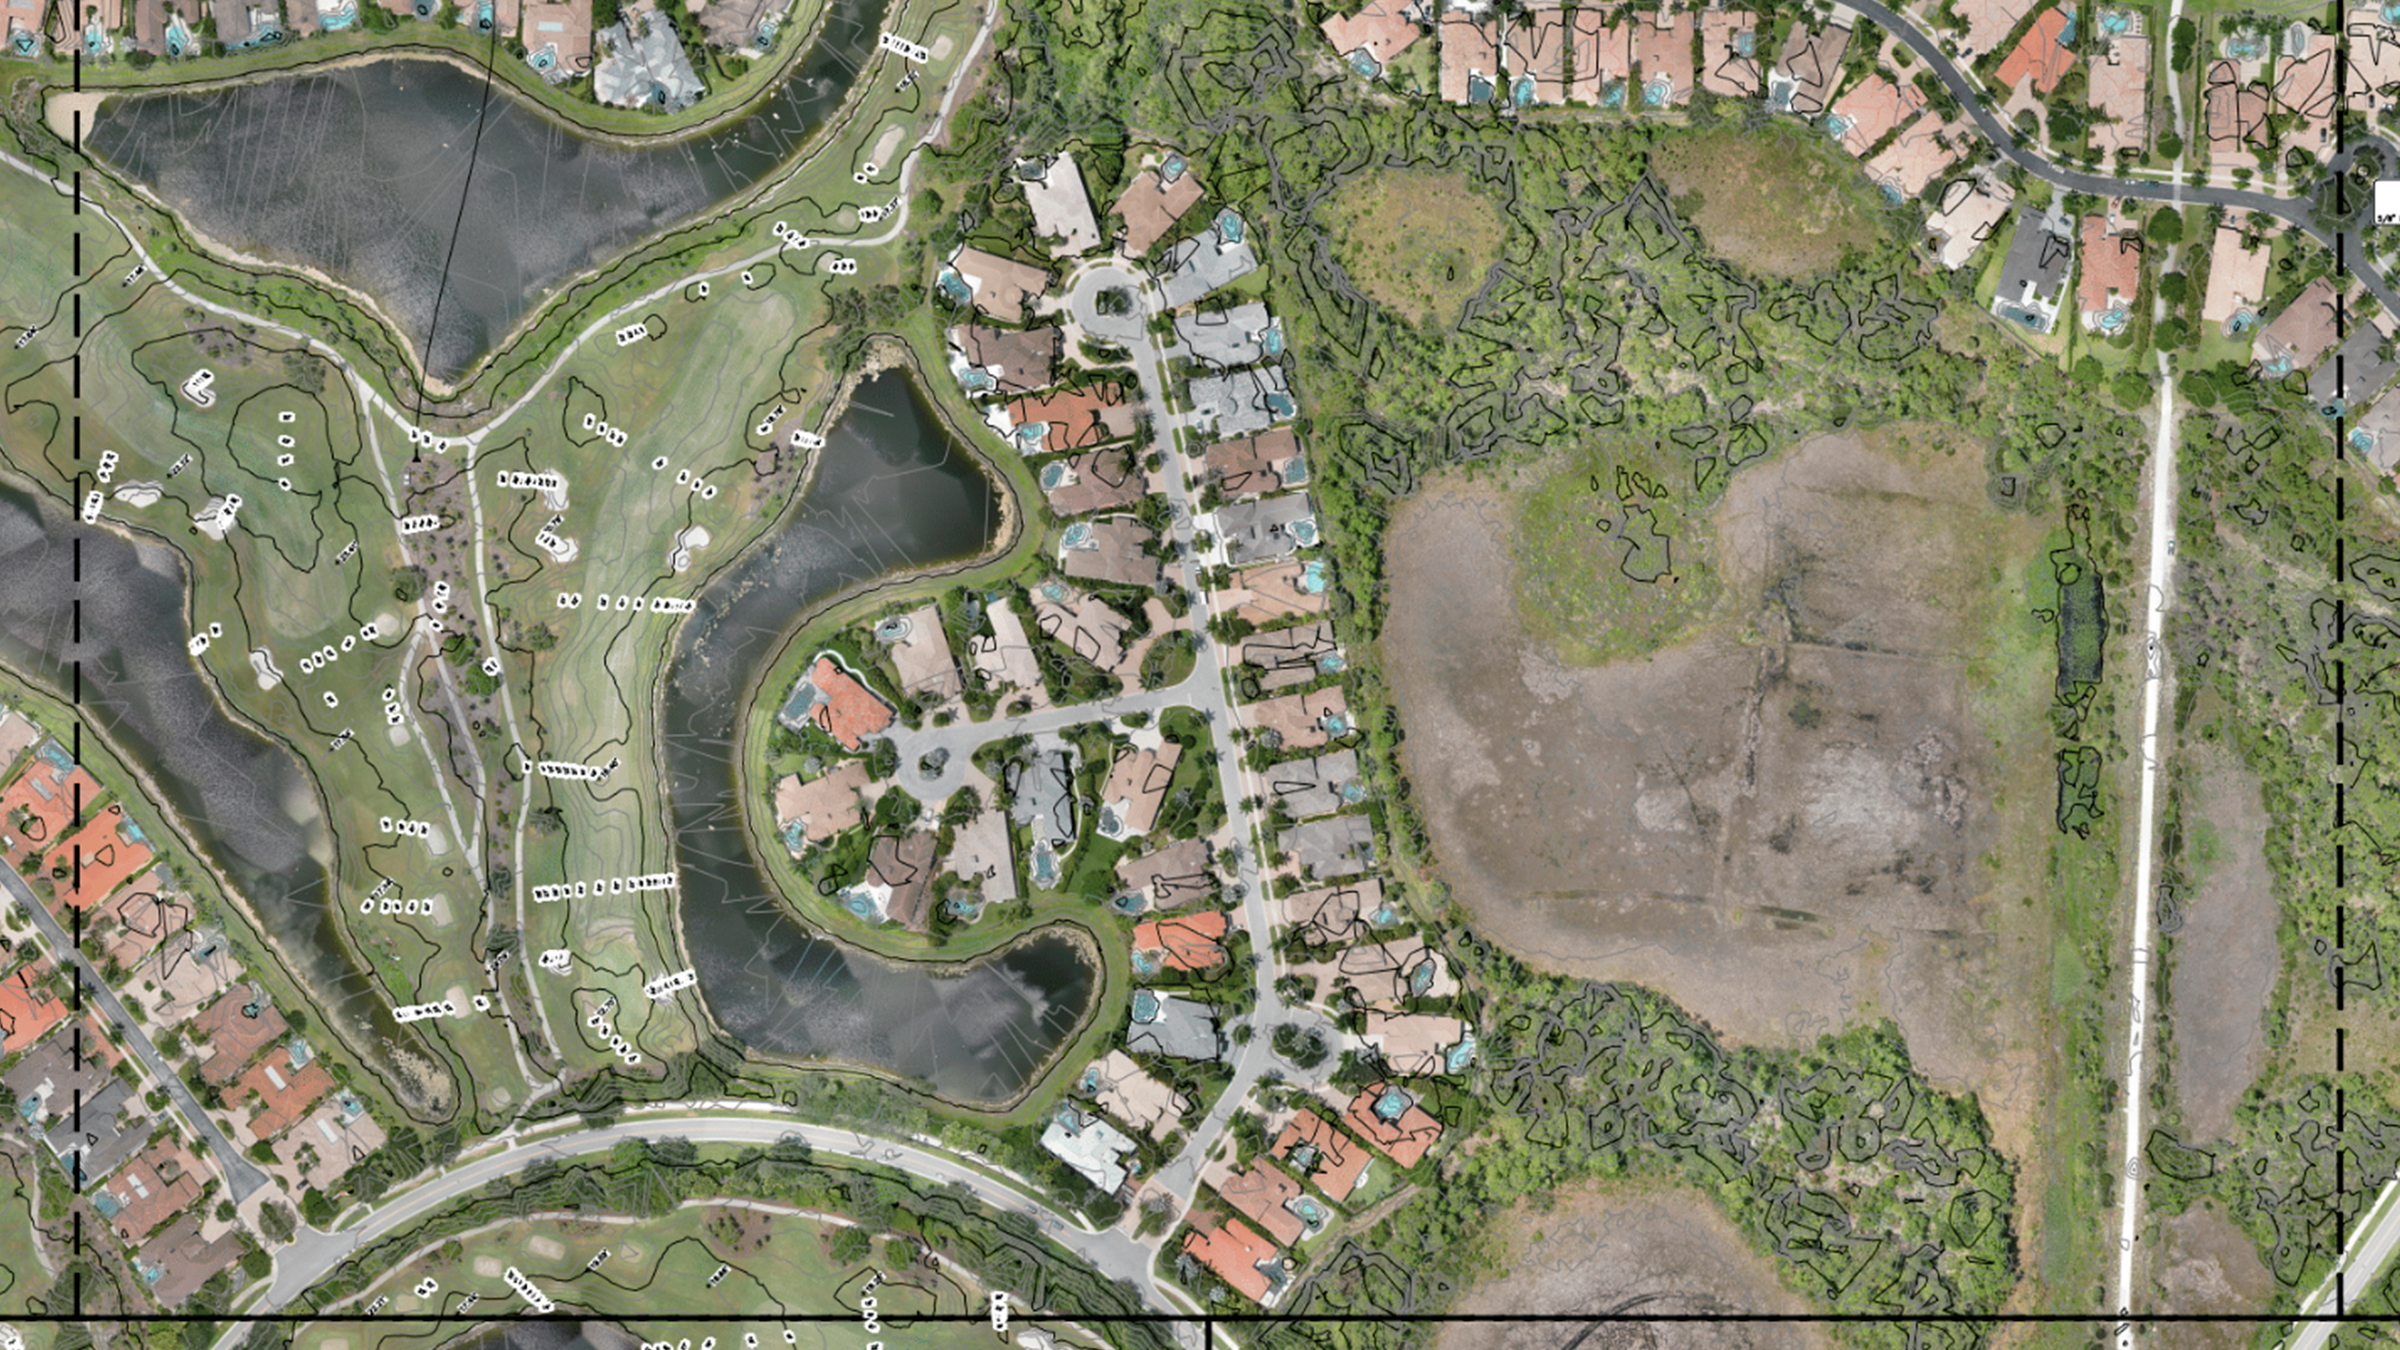
High-resolution drone imagery was processed with Pix4Dmapper photogrammetry software to produce digital surface models (DSM) of the area. Calculating the difference between the pre-storm DSM and post-storm DSM allowed the team to estimate the volumes of sand movement of the beach face.
Project details
| Institute | Deakin University |
| Country | Australia |
| Industry | Environmental Monitoring |
| Project Date | March to July 2014 |
| Project Members | Daniel Ierodiaconou, Alexandre C.G. Schimel, David M. Kennedy |
| Project Size | 22.4 Hectare |
| Number of Images | 348 |
| GSD | 2.8 cm |
| Software | Pix4Dmapper |
Chasing the storm with drones
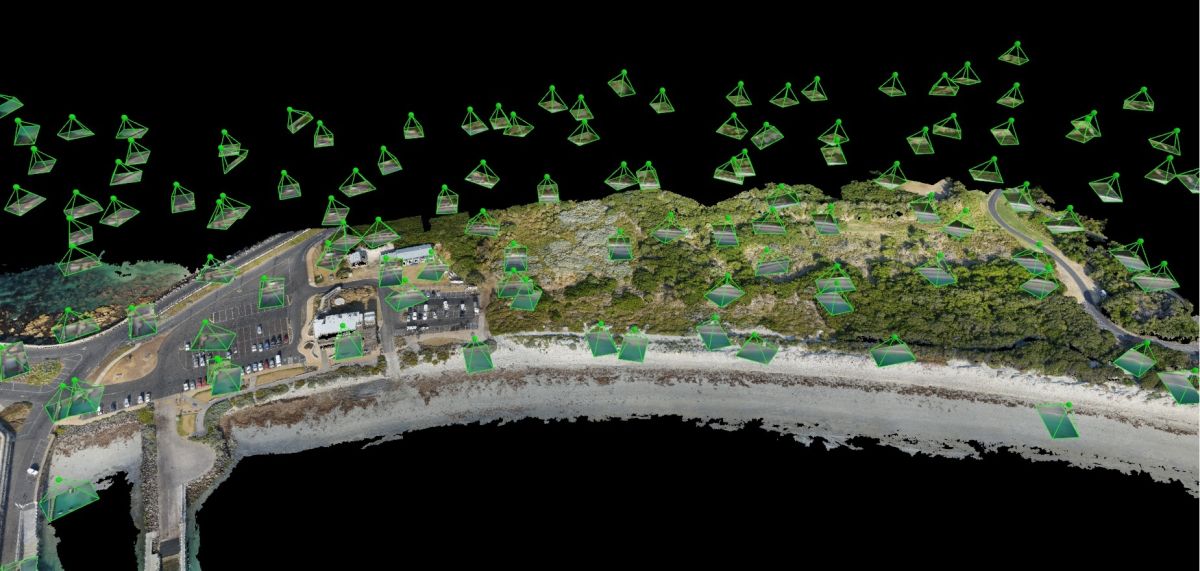
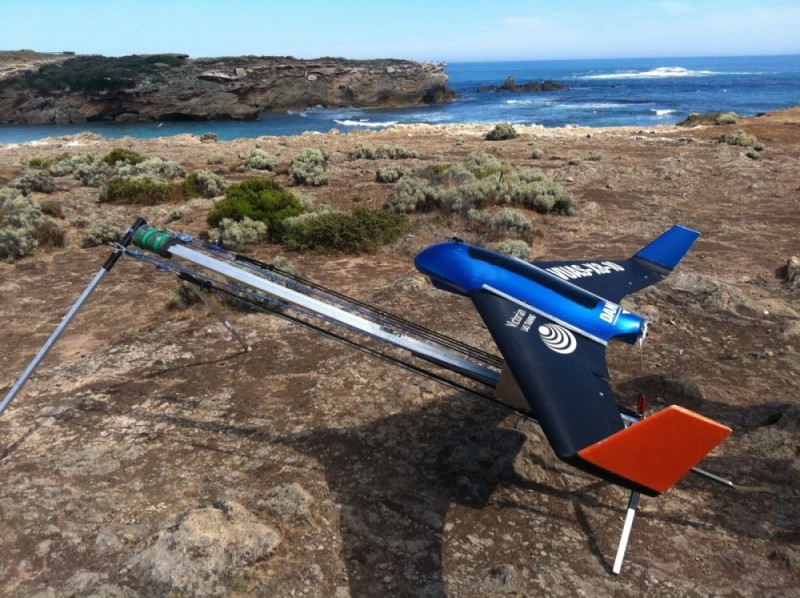
The photographs for this project were obtained from a Sony Nex-5R RGB camera equipped with a 16 mm F2.8 lens mounted in a Skywalker X8 flying wing (2.1 m wingspan, 0.8 m overall length). The flying wing also housed off-the-shelf components for automated flying, including an Ardupilot APM 2.6 flight controller, an Ublox 6 GPS sensor and an airspeed sensor.
The two surveys were carried out on the 6th of March and the 2nd of July in 2014. In both surveys, the drone was set to fly at a height of 100 meters above the Australian Height Datum (AHD). Flight paths and automatic camera triggering were set-up to ensure the capture of photographs with a 60% overlap in the along-track and 40% in the across-track direction. The surveys were repeated at 90° to the initial flight paths to ensure high data redundancy and eliminate shadowing during 3D point cloud generation.
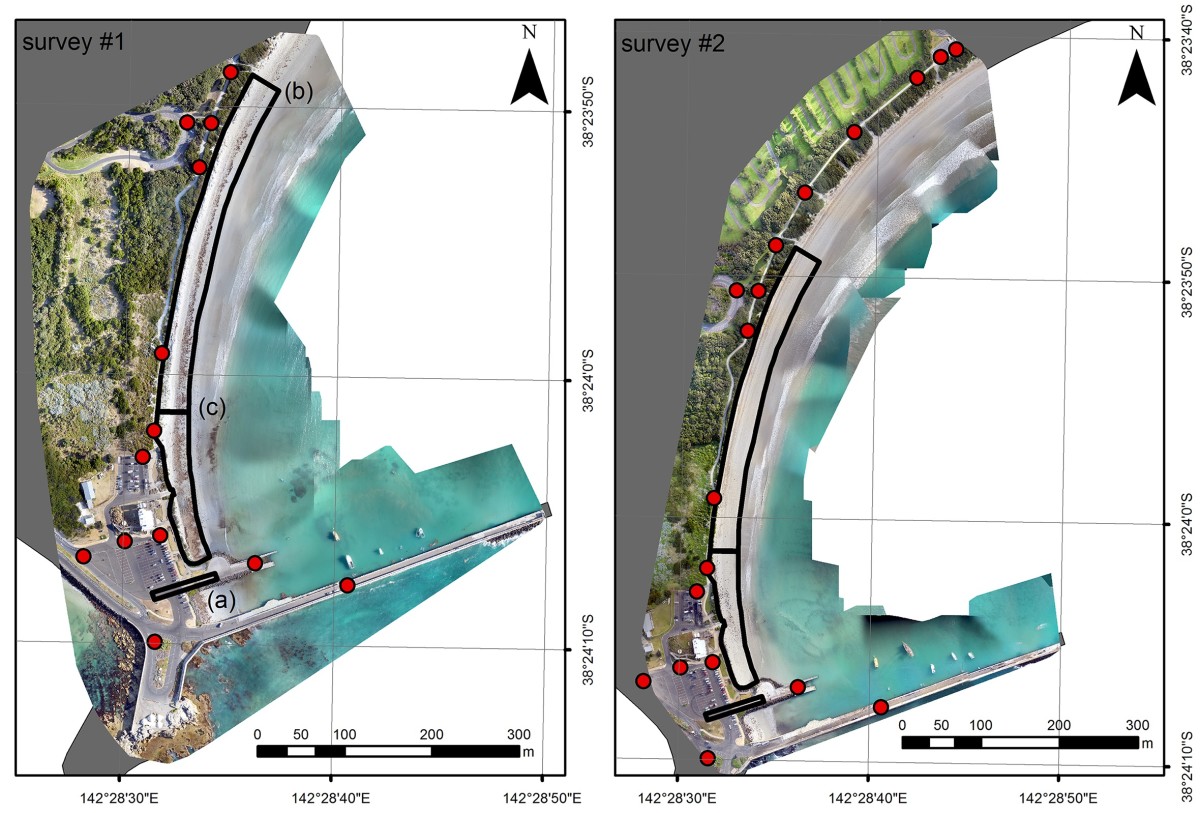
20 features on solid ground that could be easily identified in the photographs and were unlikely to change between surveys were used as ground control points. They were surveyed using a Topcon GRS-1, implementing a RTK GPS correction using the Vicmap GPSNET network of base stations. The geolocated photographs and the GCP reference data were imported into Pix4Dmapper software to produce a georeferenced orthomosaic and a digital surface model (DSM) at approximately 3-centimeter grid resolution for each survey.
Mapping the changing world
Insights into sand movement between the two surveys were then obtained by computing and analyzing the difference between the two digital surface models in Matlab.
Deposition volumes were estimated by integrating the difference over the area where it is positive and above a minimum height defined from the uncertainty in the elevation difference. Erosion volume was estimated similarly by integrating the difference over the area where it is negative and below the threshold, using fixed-wing drones like in the case of coastal erosion measurement in Planguenoual in Brittany, Northwest France. The net volume change was calculated as the addition of erosion and deposition volumes.
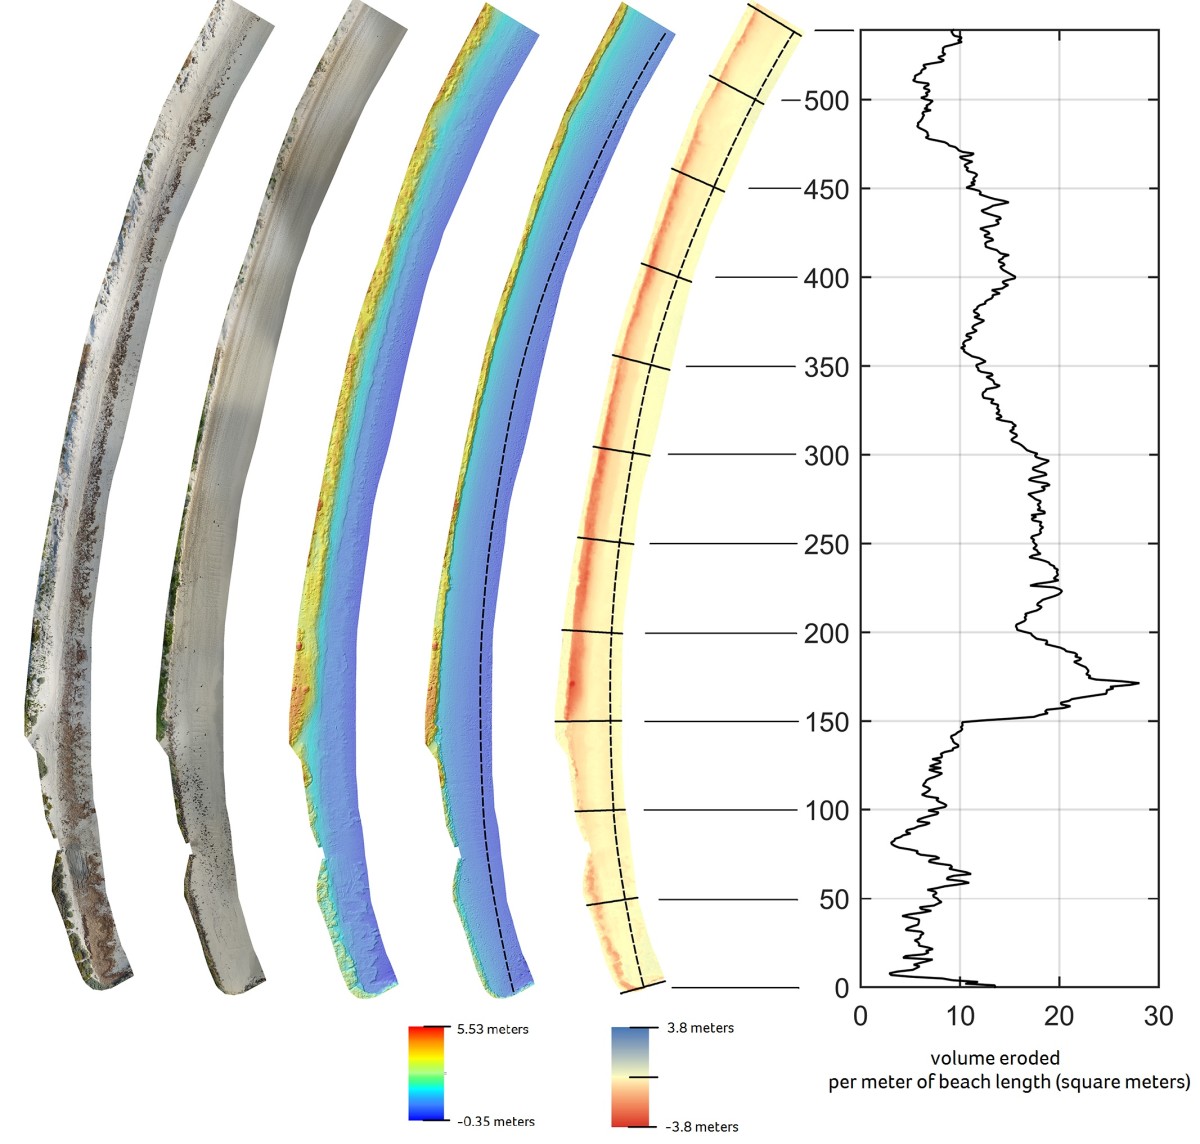
When applied on the entire beach face, these calculations provided estimates of the total volumes of sand movement.The same technique was also used for a series of 1-meter wide polygons oriented perpendicular to the 0.5-meter-interval contour (digitized from the second DSM), thereby providing an estimate of volumes of sand eroded per meter length of beach (m3/m) for the study area.
Benefits of drones in erosion volume measurement
The use of drones for low-altitude photography, combined with Pix4Dmapper’s algorithms for DSM generation led to coastal topography datasets of very high resolution and accuracy. This allowed for the quantification of even subtle changes in elevation after the storm event, with clear changes observed in vegetation and sand movement at the centimeter scale across tens of hectares. The sub-five centimeter accuracy achieved in this study is comparable, and even greater, in precision to the long term beach profile datasets usually collected using more traditional surveying techniques.One of the major benefits of drones over satellite or plane platforms is the ability of users to define revisit times that are not hampered by cloud cover or cost-prohibitive mobilization. In this study, both surveys only required a total flying time of approximately 40 min in addition to a small amount of preparation to design the survey plan and conduct the necessary risk assessments (< 1 hr).
In addition, the data density translates into a detailed textured TIN model that allows for an unlimited number of “virtual” oblique views from any user-defined angle or height to investigate coastal processes. Such oblique views offer advantages over the traditional aerial photogrammetric perspective (i.e. straight down) where key parameters such as the degree of notching are not apparent. This is particularly problematic in cliff hazard assessments as the height and depth of notches is often a key parameter in determining cliff stability.